SAT Practice Test Score Interpretation
Learn where your actual gaps are, not just where your score sits.

There's a particular kind of student I've seen dozens of times. They finish a practice SAT, get their score back, feel something about it (relief, dread, mild confusion), and then... move on. Maybe they circle a few wrong answers. Maybe they tell themselves they'll "study more." The score report sits in a browser tab for a few days before it quietly closes.
That student is leaving points on the table. A lot of them.
Here's the thing: the score report isn't just your result. It's your next assignment. Every section, every domain flag, every wrong question is pointing at something specific. The students who figure that out first close their gaps faster. The ones who don't keep practicing without improving.
Let's walk through exactly how to read one of these things.
Where the National Benchmarks Actually Sit in 2025
First, a quick grounding in the landscape.
The mean SAT score across two million-plus test-takers in 2025 was 1,029, per College Board's annual data. Just over half of all students scored at or above 1,000. So right away, you have a sense of where the middle of the distribution sits.
A few useful landmarks:
- 1,150 is roughly the 70th percentile
- 1,230 is roughly the 80th percentile
- 1,400 and above represents about 7.5% of test-takers (the 93rd percentile and up)
That last number surprises a lot of students. The top of the range feels more crowded than it is.
But here's the important caveat. National percentile ranks are interesting context, not your actual target. What matters is the score range that your specific colleges actually use in admissions decisions. A 1,200 might be safely above median at one school and below it at another. The national average doesn't tell you that.
One more thing worth knowing before you interpret your own score. Every score comes with what College Board calls an Individual Score Range, roughly plus or minus 30 points, which reflects standard measurement error in standardized testing. That means a 1,230 and a 1,200 are not meaningfully different scores. Single-point differences between practice tests are noise. Don't celebrate or panic over them.
That raises a better question, though. Once you know where you sit nationally, how do you figure out why you're there? That's what the rest of the report is for.
What the Score Report Contains Beyond the Headline Number
Most students look at two things: total score and maybe section scores. That's the top layer. It's also the least useful layer for actually improving.
Here's what the full Digital SAT score report actually shows you:
- Total score (400–1600)
- Section scores for Reading and Writing (200–800) and Math (200–800)
- Percentile rankings
- College readiness benchmarks (did you meet them, or not)
- Knowledge and skills area performance levels broken down by domain, rated as Approaching, Proficient, or Below
That last one is where the prep decisions happen.
The Digital SAT replaced the older subscores (Heart of Algebra, Passport to Advanced Math, and so on) with these broader domain-level performance levels. They're less granular in name, but they still tell you something specific: which academic territory you're struggling in.
For Reading and Writing, the domains cover things like Standard English Conventions, Information and Ideas, and Rhetorical Craft. Each requires a different kind of fix. Getting commas wrong is a different problem from misreading what an argument's conclusion is. The score report won't fix that for you, but it will tell you which drawer to look in.
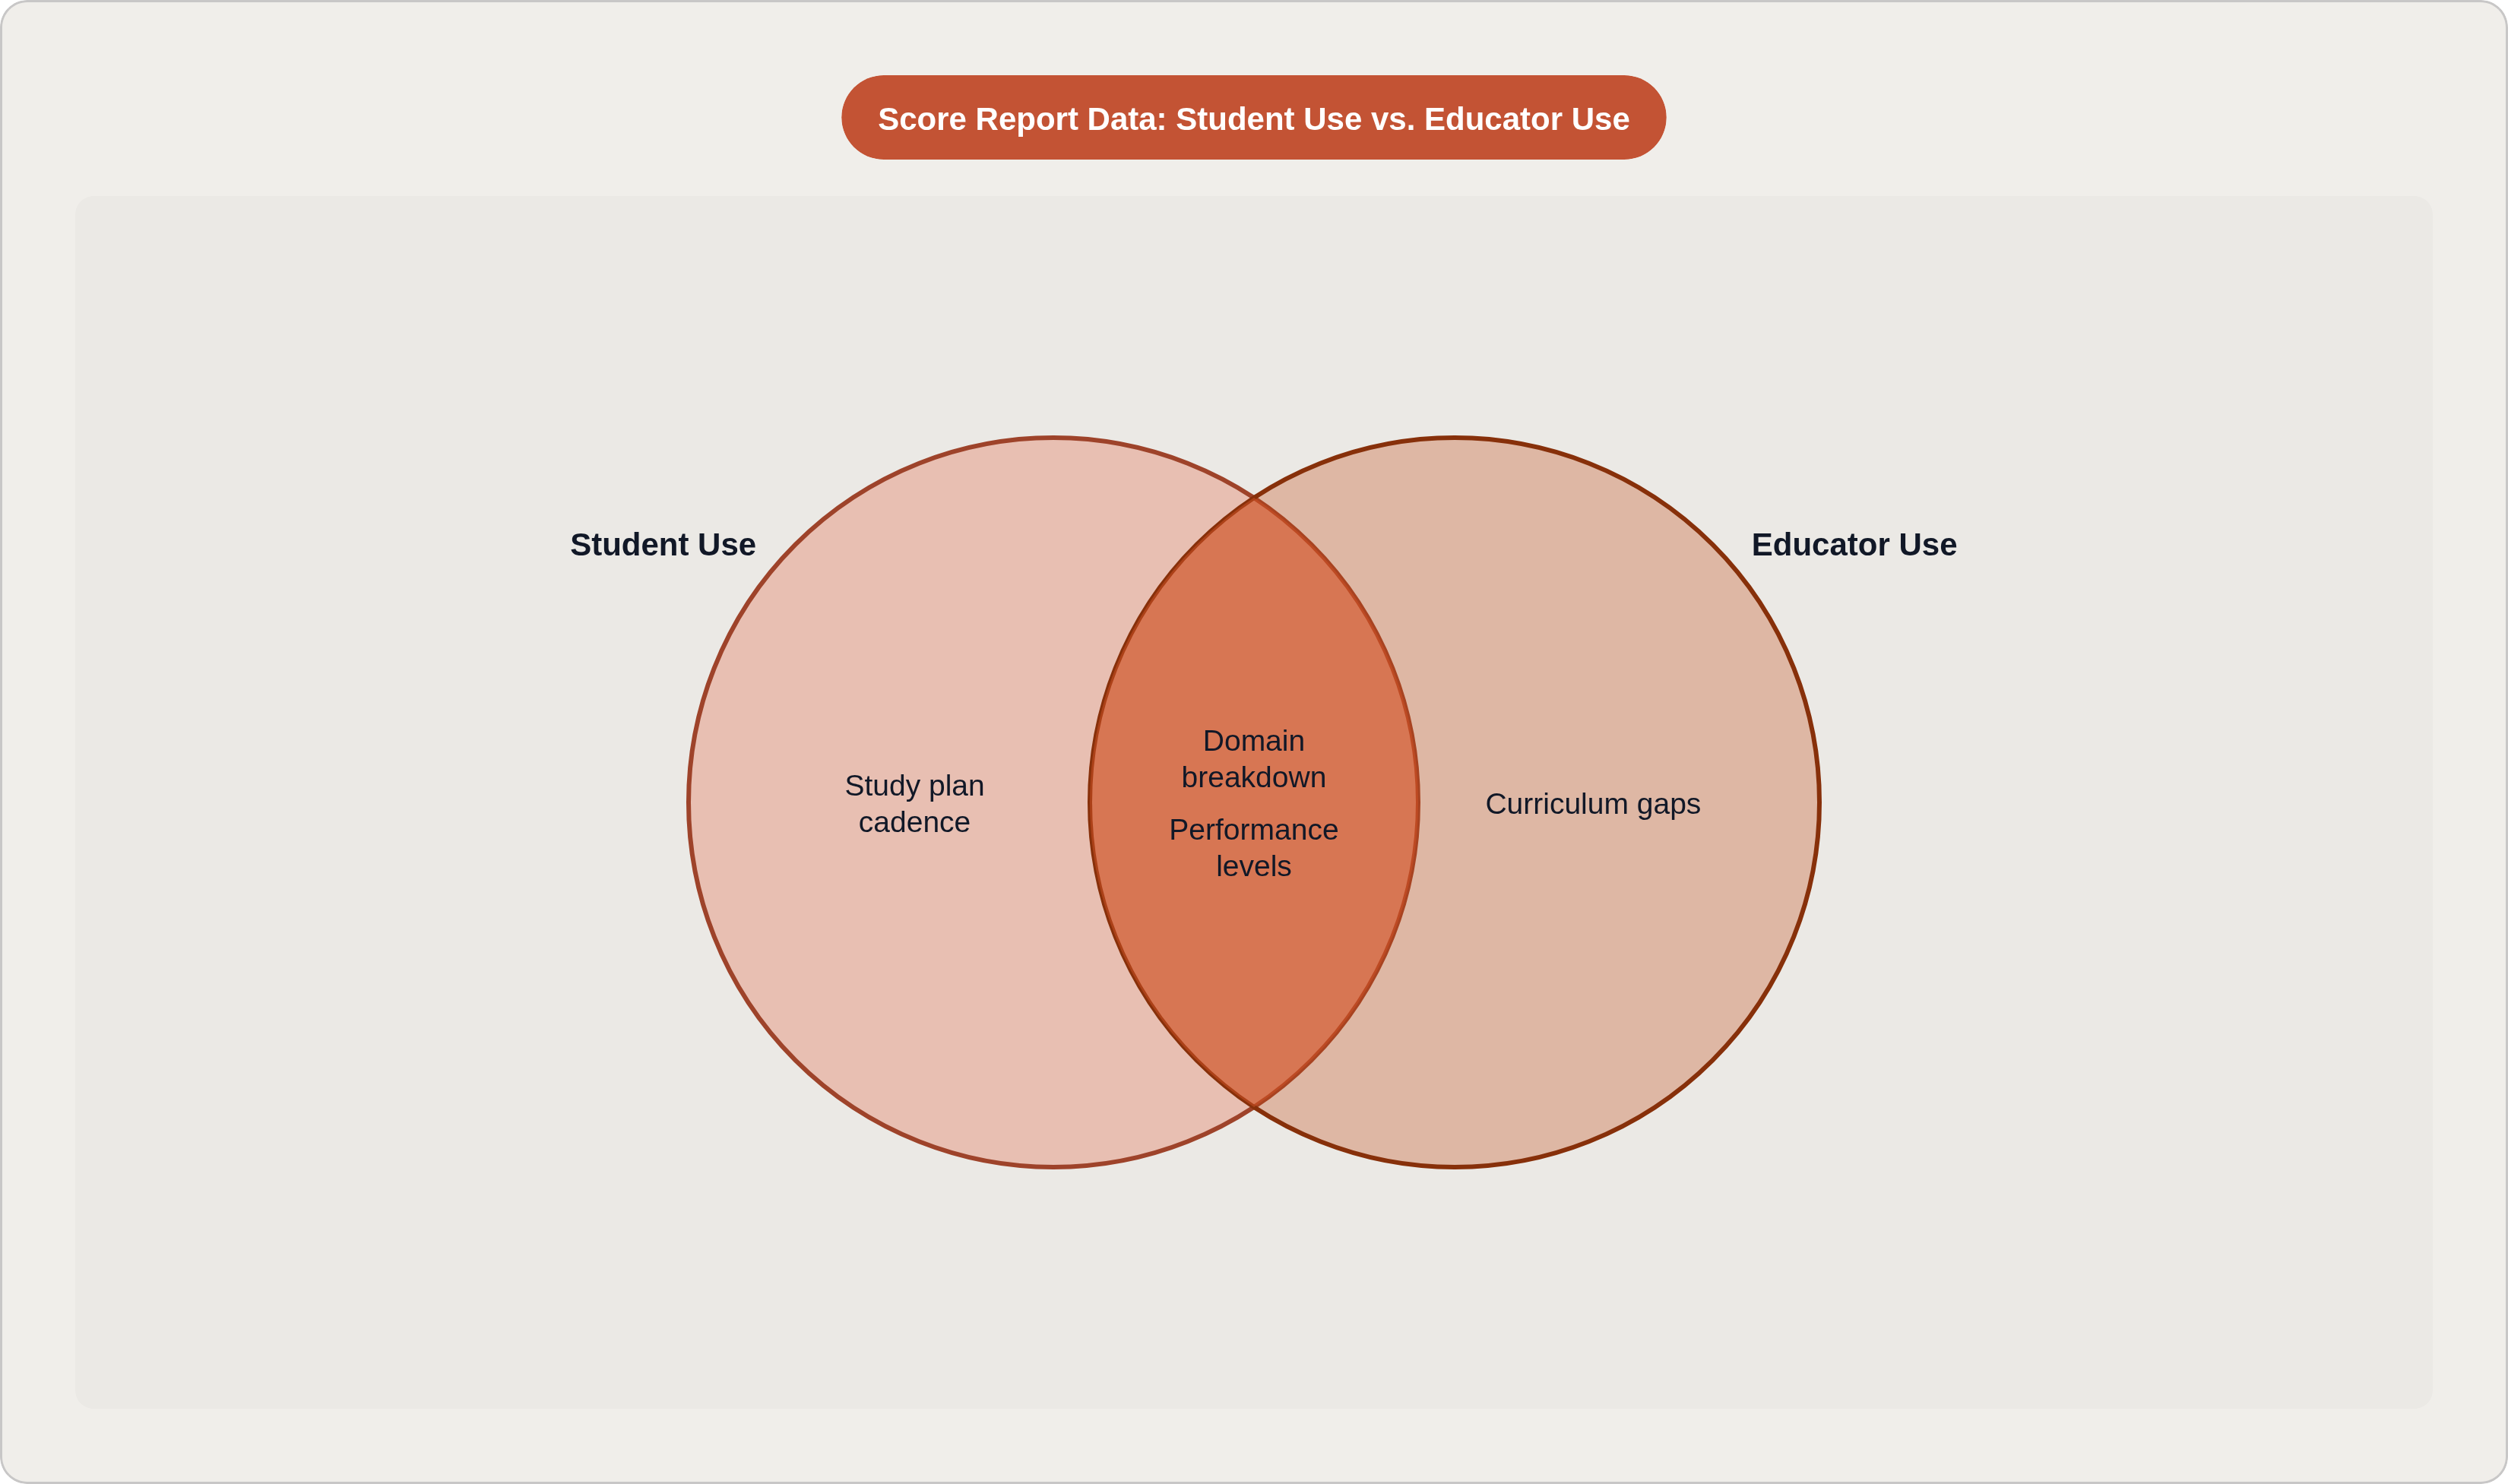
One thing worth noting. Colleges only see your total score and section scores. The domain breakdown is entirely for your prep use. No admissions officer is reading your Knowledge and Skills performance levels. That's actually good news. It means that data exists purely to help you improve.
The common mistake is stopping at the section score. A student sees a 620 in Math, thinks "I need to work on math," and opens a random problem set. That's not a plan. That's activity without direction.
How to Move from a Score Report to a List of Specific Gaps
Let me walk you through the actual process, step by step.
Start with sections. Which section score is furthest from your goal? That's where you dig first.
Move into the domain breakdown. Within that section, which knowledge and skills areas are marked Below or Approaching? Those are your priority zones.
Go question-level. This is the step most students skip, and it's the one that matters most. Review every missed question and ask one specific thing: why did I miss this?
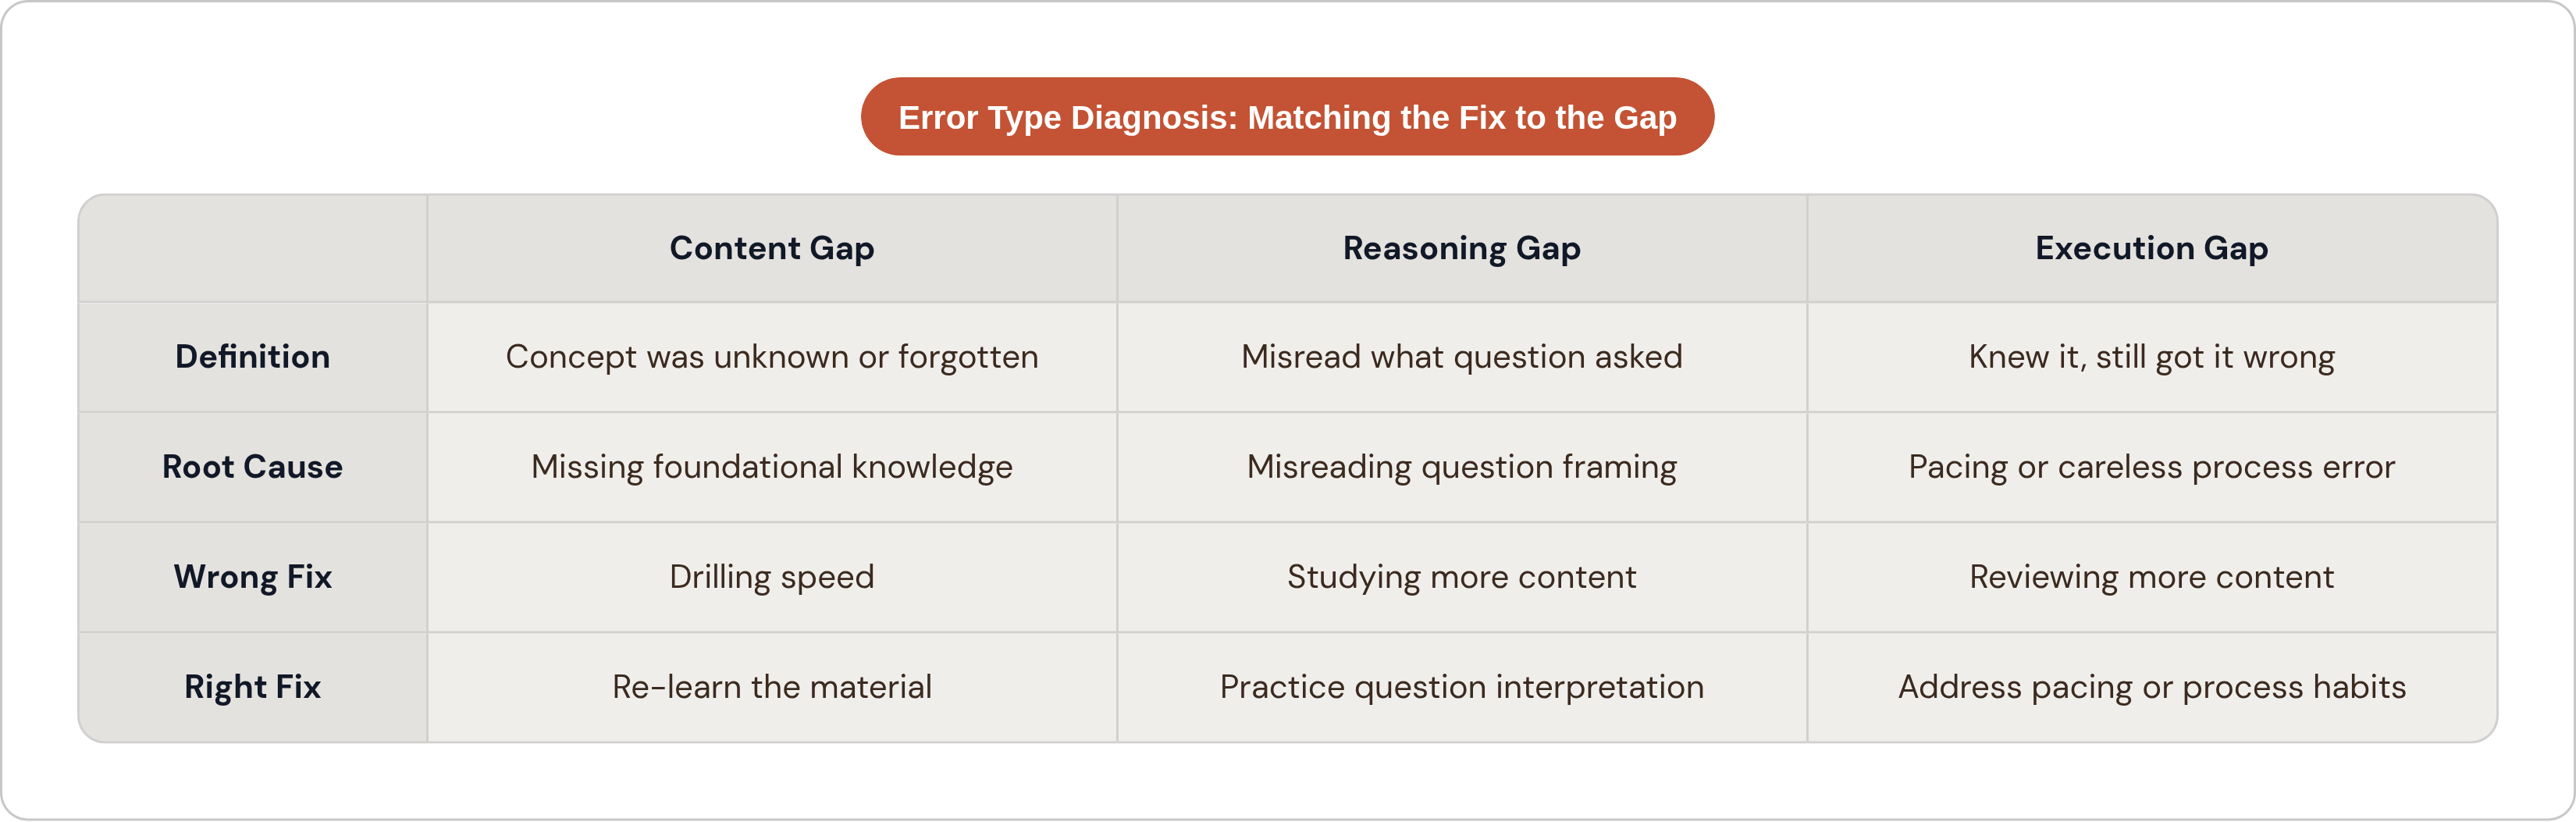
There are really only three categories:
- Content gap. You didn't know the concept. This requires learning or re-learning the material.
- Reasoning gap. You understood the concept but misread what the question was actually asking. This requires practice with how questions are framed.
- Execution gap. You knew the concept, understood the question, and still made a careless error. This is often a pacing or process problem.
Each one has a different fix. Studying more content doesn't help an execution gap. Drilling speed doesn't help a content gap. Mixing them up is how students spend 20 hours and move 5 points.
Look for patterns across multiple tests. One missed question in a domain could be noise. The same domain flagged as Below across three practice tests is signal. Don't overreact to a single result.
There's also a subtler signal that gets overlooked. The Digital SAT uses a multistage adaptive testing format, meaning it is section-adaptive. Your performance in Module 1 determines whether Module 2 is the harder or easier version. Students who consistently land in the easier Module 2 aren't just having rough test days. They're showing a foundational weakness in Module 1 skills. That's worth noting separately.
The end goal of all this is a short, specific list. Not "I need to work on math." Something more like: "I need to work on systems of equations and percent change word problems." That's a plan you can actually execute.
What the Research Shows About Practice Volume and Score Gains
Here's where it gets interesting. Practice volume does matter. But it's not the whole story.
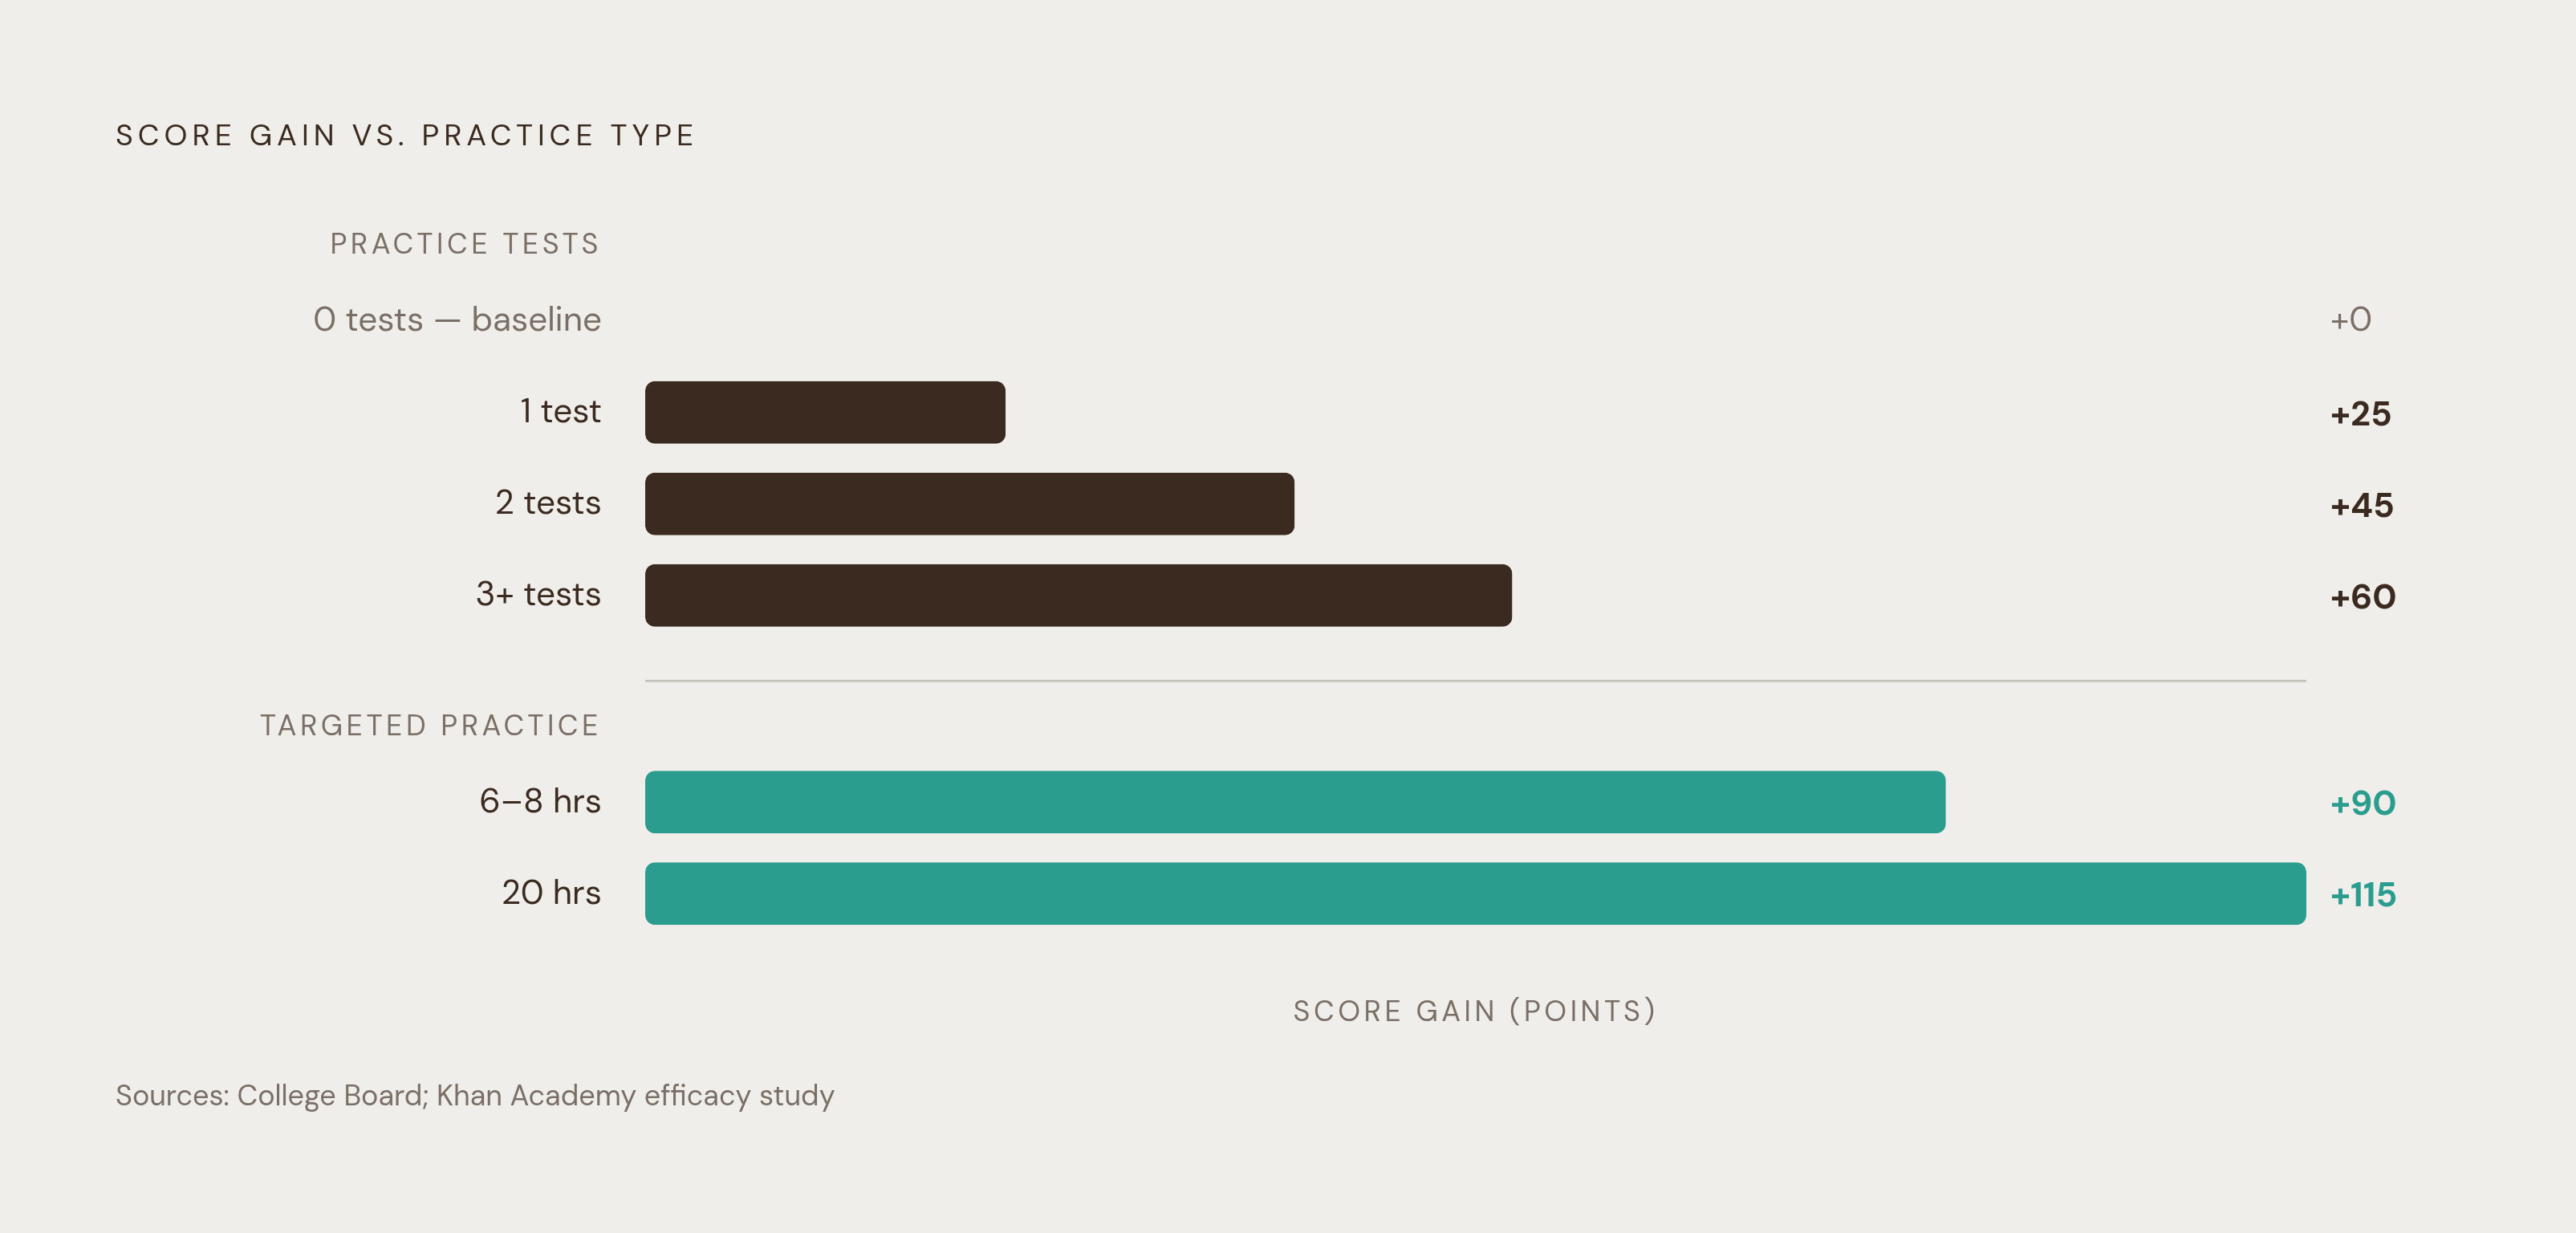
College Board data shows a clear pattern: students who complete one full-length practice test score about 25 points higher on average than students who take none. Two tests brings that up to roughly 45 points. Three or more brings it to around 60. The trend is consistent.
But what's driving those gains? It's not just the exposure to questions. It's using the score report between tests to direct your practice. Volume without diagnosis produces diminishing returns fast.
The research on Official SAT Practice (the Khan Academy partnership, from data that predates the Digital SAT) found that 20 hours of targeted, personalized practice was associated with an average 115-point gain. Six to eight hours was associated with roughly 90 points. The gap between those numbers is smaller than most people expect. What made the 20-hour group improve more wasn't just that they spent more time. It's that the practice was targeted to identified weak areas.
One more finding worth sitting with. Students with lower starting scores saw the largest average gains from practice tests. The students with the most ground to cover benefit most from systematic gap-closing. That's not a consolation. It's a real opportunity.
The practice test is not the destination. It is a formative assessment tool that tells you where to put the next 20 hours.
Where Unguided Practice Hits a Ceiling
Free platforms like Khan Academy and the Bluebook app give students access to real, official practice questions. That's genuinely valuable. Thousands of questions, adaptive drills, aligned to the actual test. No cost.
But for students targeting scores in the 1,350 to 1,550 range, something starts to plateau. The platform tells you what you got wrong. It doesn't reliably tell you why you keep getting that category wrong. There's no persistent error log or error taxonomy. No tracking of whether a skill gap is closing or just dormant. No way to distinguish a structural weakness from a bad day.
And that distinction matters.
A structural gap is one that shows up across question formats, across sessions, across test dates. A situational gap is a one-time thing. Confusing the two sends students down the wrong path. They drill a topic that wasn't the real problem, feel like they studied hard, and then miss a very similar question two weeks later.
The core issue isn't a lack of practice problems. Most students have access to more problems than they could ever complete. The missing layer is knowing which gaps are actually limiting their score, and whether the fixes they're applying are working.
A student who reviews wrong answers without categorizing the error type will likely repeat the same mistake on a harder variant of the same concept. That's not a practice problem. That's a feedback problem.
How Adaptive Feedback Systems Close the Gap That Score Reports Leave Open
So what does a better feedback loop actually look like?
A 2026 peer-reviewed study in Applied Sciences (MDPI) looked at AI-generated Personalized Learning Pathways for secondary students. The finding was nuanced: AI-generated pathways significantly reduced lower-order learning gaps. Higher-order skills were harder to address through AI alone. The research suggested that hybrid models combining AI tools with teacher input produced better outcomes than either alone.
That tracks with what I've seen in practice.
What adaptive systems do well, and what static score reports can't do at all:
- Track whether a skill gap is closing or persisting across multiple sessions
- Distinguish between a gap in foundational knowledge and a gap in applying that knowledge under timed, test-format conditions
- Adjust difficulty in real time so students are working at the edge of their current ability, not reviewing material they've already mastered
There's also a cognitive load argument here. When students have to self-diagnose their gaps, figure out what to study next, and then actually study, they're juggling three different jobs at once. An adaptive system handles the first two. That frees up mental energy for the third job, which is the one that actually moves the score.
Quick clarification that's worth making explicit. When we're talking about AI tools in prep platforms, we're talking about tools that track patterns, generate feedback, and surface error types. The SAT itself uses algorithmic scoring with human oversight. Not the same thing. Don't confuse them.
The meaningful question to ask when you're evaluating any practice tool: does it tell you what you got wrong, or does it tell you why you keep getting that category wrong? One of those is useful. The other is a start.
How Teachers and Schools Can Use Practice Score Data at Scale
Everything we've covered applies to individual students. But the same logic scales up.
College Board's K–12 portals give educators access to the same domain-level data, surfaced at the class or school level. The analytical shift for educators is moving from "this student is struggling" to "this skill gap is shared."
If 60% of a class is Below benchmark in the same knowledge and skills area, that's a curriculum problem. It's not 18 individual student problems that each need individual solutions. That kind of shared signal is actually easier to act on, because one targeted instructional intervention can move a lot of students at once.
A Gallup survey found that roughly 60% of teachers used AI tools during the 2024–25 school year. Adoption is already mainstream. But here's the question worth asking: are those tools being used for diagnostic work, or just content generation? Because diagnostic use is where the leverage is.
Effective educator dashboards do a few specific things:
- Surface students near score thresholds where targeted work would move them into the next percentile band
- Flag students who have plateaued despite completing volume. That pattern usually means error type, not effort level, is the variable to address
- Standardize feedback quality so grading doesn't shift based on how tired a teacher is on a given afternoon
One framework I find useful: roughly 70% of most students' score gaps are conceptual, about 20% are test-taking mechanics, and about 10% are time management. The numbers aren't exact for every student. But the proportion matters. Most of the gap is content. Strategy work alone doesn't fix it.
The teacher's leverage point is identical to the student's. The domain breakdown, not the total score, is where instruction gets specific enough to actually help.
Turning the Score Report into a Study Plan with a Concrete Timeline
Let's put it all together.
Step one. Pull the full score report. Not just the total. Section scores, domain performance levels, individual question review. All of it.
Step two. Categorize each gap by type (content, reasoning, or execution) and by frequency. How often does this error appear, and across how many question types?
Step three. Rank gaps by impact.
A domain marked Below that covers a large portion of a section's questions will move your score more than an Approaching domain with minimal question volume. And foundational gaps are worth addressing first, because they tend to block progress in higher-order skills that sit on top of them. Fix the floor before you renovate the ceiling.
Step four. Build a practice cadence that includes full-length Bluebook tests at regular intervals, not just targeted drills. Each full test generates a new score report, which resets the diagnostic cycle. Drills build skills. Full tests reveal whether those skills hold under real conditions.
Remember the Individual Score Range. Plus or minus 30 points means small fluctuations between practice tests are noise. What you're looking for is directional movement in your domain performance levels over multiple tests, not single-point score changes. That's the signal. The rest is variance.
One last thing, and it's the most important reframe in this whole piece.
The score report is not a verdict. It's the most recent data point in an ongoing feedback loop. Students who treat each practice test as a diagnostic close gaps faster than students who treat it as a performance.
The number tells you where you are. The report tells you why. And the gap between those two things is exactly where the work happens.