AP Microeconomics Exam Format and High-Yield Topics
Study Units 2 and 3 first, then practice drawing and labeling graphs by hand.

AP Microeconomics doesn't ask you to memorize a textbook. It asks you to take economic logic and apply it to a situation you've never seen before, on the spot, under time pressure. That's a different skill than knowing what "deadweight loss" means. Knowing the definition and being able to draw it, label it, and explain why a specific policy caused it are two separate jobs, and the exam is built to test the second one far more than the first.
That distinction matters because it changes how you should study. If the test rewarded pure recall, you'd study flashcards. Since it rewards application, the smarter move is to study the exam's own structure first, then let that structure tell you where to spend your hours. What follows is a breakdown of exactly how the test is built, what it weighs, and which topics carry the most points, so you can stop guessing and start studying in the order that actually pays off.
How the exam is structured: sections, timing, and scoring weights
The full exam runs 2 hours and 10 minutes, split into two sections that behave nothing like each other.
Section I, Multiple Choice:
Section II, Free Response:
Multiple choice carries twice the weight of free response, so raw point volume favors MCQ prep. But the free response section asks for a completely different kind of output, drawing an accurate graph, labeling it correctly, and writing a justification that uses the right economic term in the right place. You can't cram for that the night before. It has to be practiced like a motor skill, not reviewed like a vocabulary list.
How the hybrid digital format changes exam-day preparation
Starting in 2026, AP Microeconomics moved to a hybrid digital format, and that shift changes what "exam-day ready" actually means.
Multiple choice questions and the free response prompts are delivered through the Bluebook testing app, on either a school-managed device or a personal one. But the free response answers themselves are still handwritten, in a paper booklet that gets collected separately for scoring.
That means test day involves switching between two completely different modes: reading and answering on a screen, then picking up a pen to draw a supply and demand graph by hand. If your only practice has been clicking through digital flashcards, that switch will cost you time and focus you don't have to spare.
Only a 4-function calculator is allowed, and Bluebook has one built in through Desmos. Scientific and graphing calculators are off the table. Since AP Microeconomics math rarely goes past basic arithmetic and slope calculations, this isn't a huge loss, but it's one more reason to practice your math the plain way rather than leaning on a calculator that won't be there.
Unit weightings
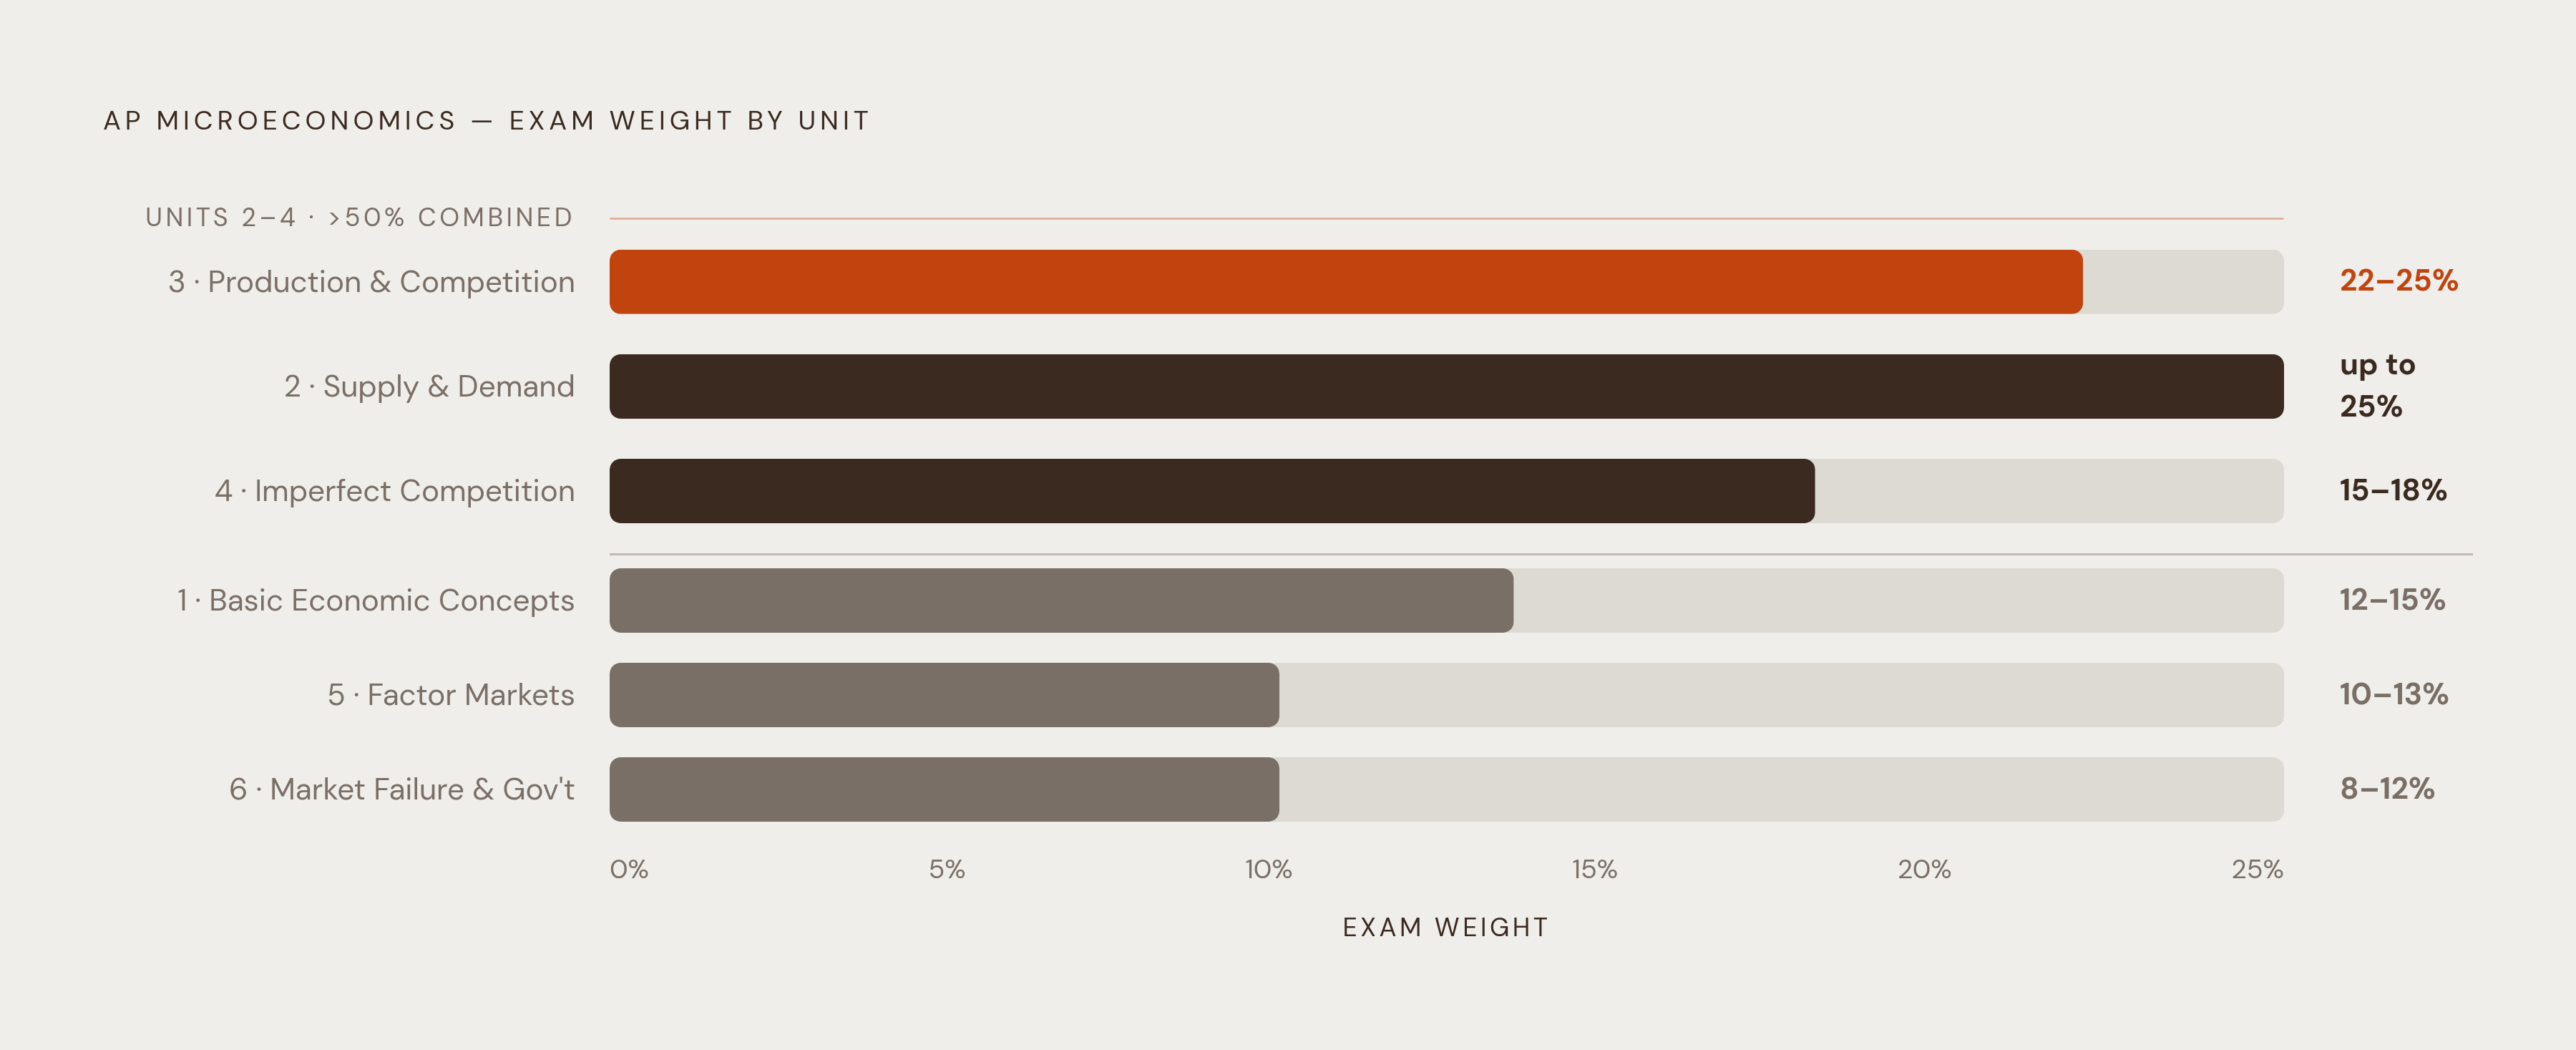
The course is split into six units, and each one comes with an official exam weighting range. That range is basically a study map handed to you in advance.
Unit 1, Basic Economic Concepts: 12 to 15%
Add up Units 2, 3, and 4, and they cover well over half the entire exam. That's not a subtle hint. If your study time isn't concentrated there, it's misallocated.
Unit 3 has the highest guaranteed floor of any single unit, 22%, which makes Production, Cost, and Perfect Competition the safest bet for a large chunk of your score no matter how the exam splits its questions in a given year. Unit 2 shares the same 25% ceiling, so the two units are essentially tied at the top. Together they're the backbone of the test.
The highest-yield topics within the top three units
Some topics appear far more often in those three units than others, because the exam concentrates its questions on them. These are the ones to master first.
Unit 2, Supply and Demand:
Unit 3, Production, Cost, and Perfect Competition:
- The profit-maximizing rule, MR = MC, arguably the single most-tested decision rule in the entire course
- How the marginal cost curve intersects average total cost and average variable cost, and what each intersection point actually tells you
- The shutdown decision versus the exit decision, a distinction that trips up a lot of students because the two look similar but aren't
- Long-run equilibrium in a perfectly competitive market, where economic profit hits zero and price settles at minimum average total cost
- The difference between economic profit, accounting profit, and normal profit
Unit 4, Imperfect Competition:
That last one deserves a callout: on recent exams, students actually performed best on the free response item built around a payoff matrix and Nash equilibria. Game theory sounds intimidating, but it turns out to be one of the more learnable, high-return topics on the whole test. A little targeted practice here goes a long way.
The graphs and formulas students must have internalized before exam day
Graphs are where the exam quietly separates the students who studied from the students who studied the right way.
Free response questions don't ask you to recognize a graph in a multiple choice option. They ask you to draw one, label every curve and point correctly, and then explain what it means in writing. That's a different level of fluency than reading a graph someone else already drew.
The graphs worth having down cold:
The formulas to have memorized cold:
None of this is a list to memorize and forget. It's a toolkit to practice using inside multi-step scenarios, especially since the hybrid format means your final execution is handwritten. Knowing the formula for marginal revenue product doesn't help if your hand hasn't practiced applying it under a multi-part free response question.
What the score distribution reveals about where students struggle
The score data tells a consistent story, year over year.
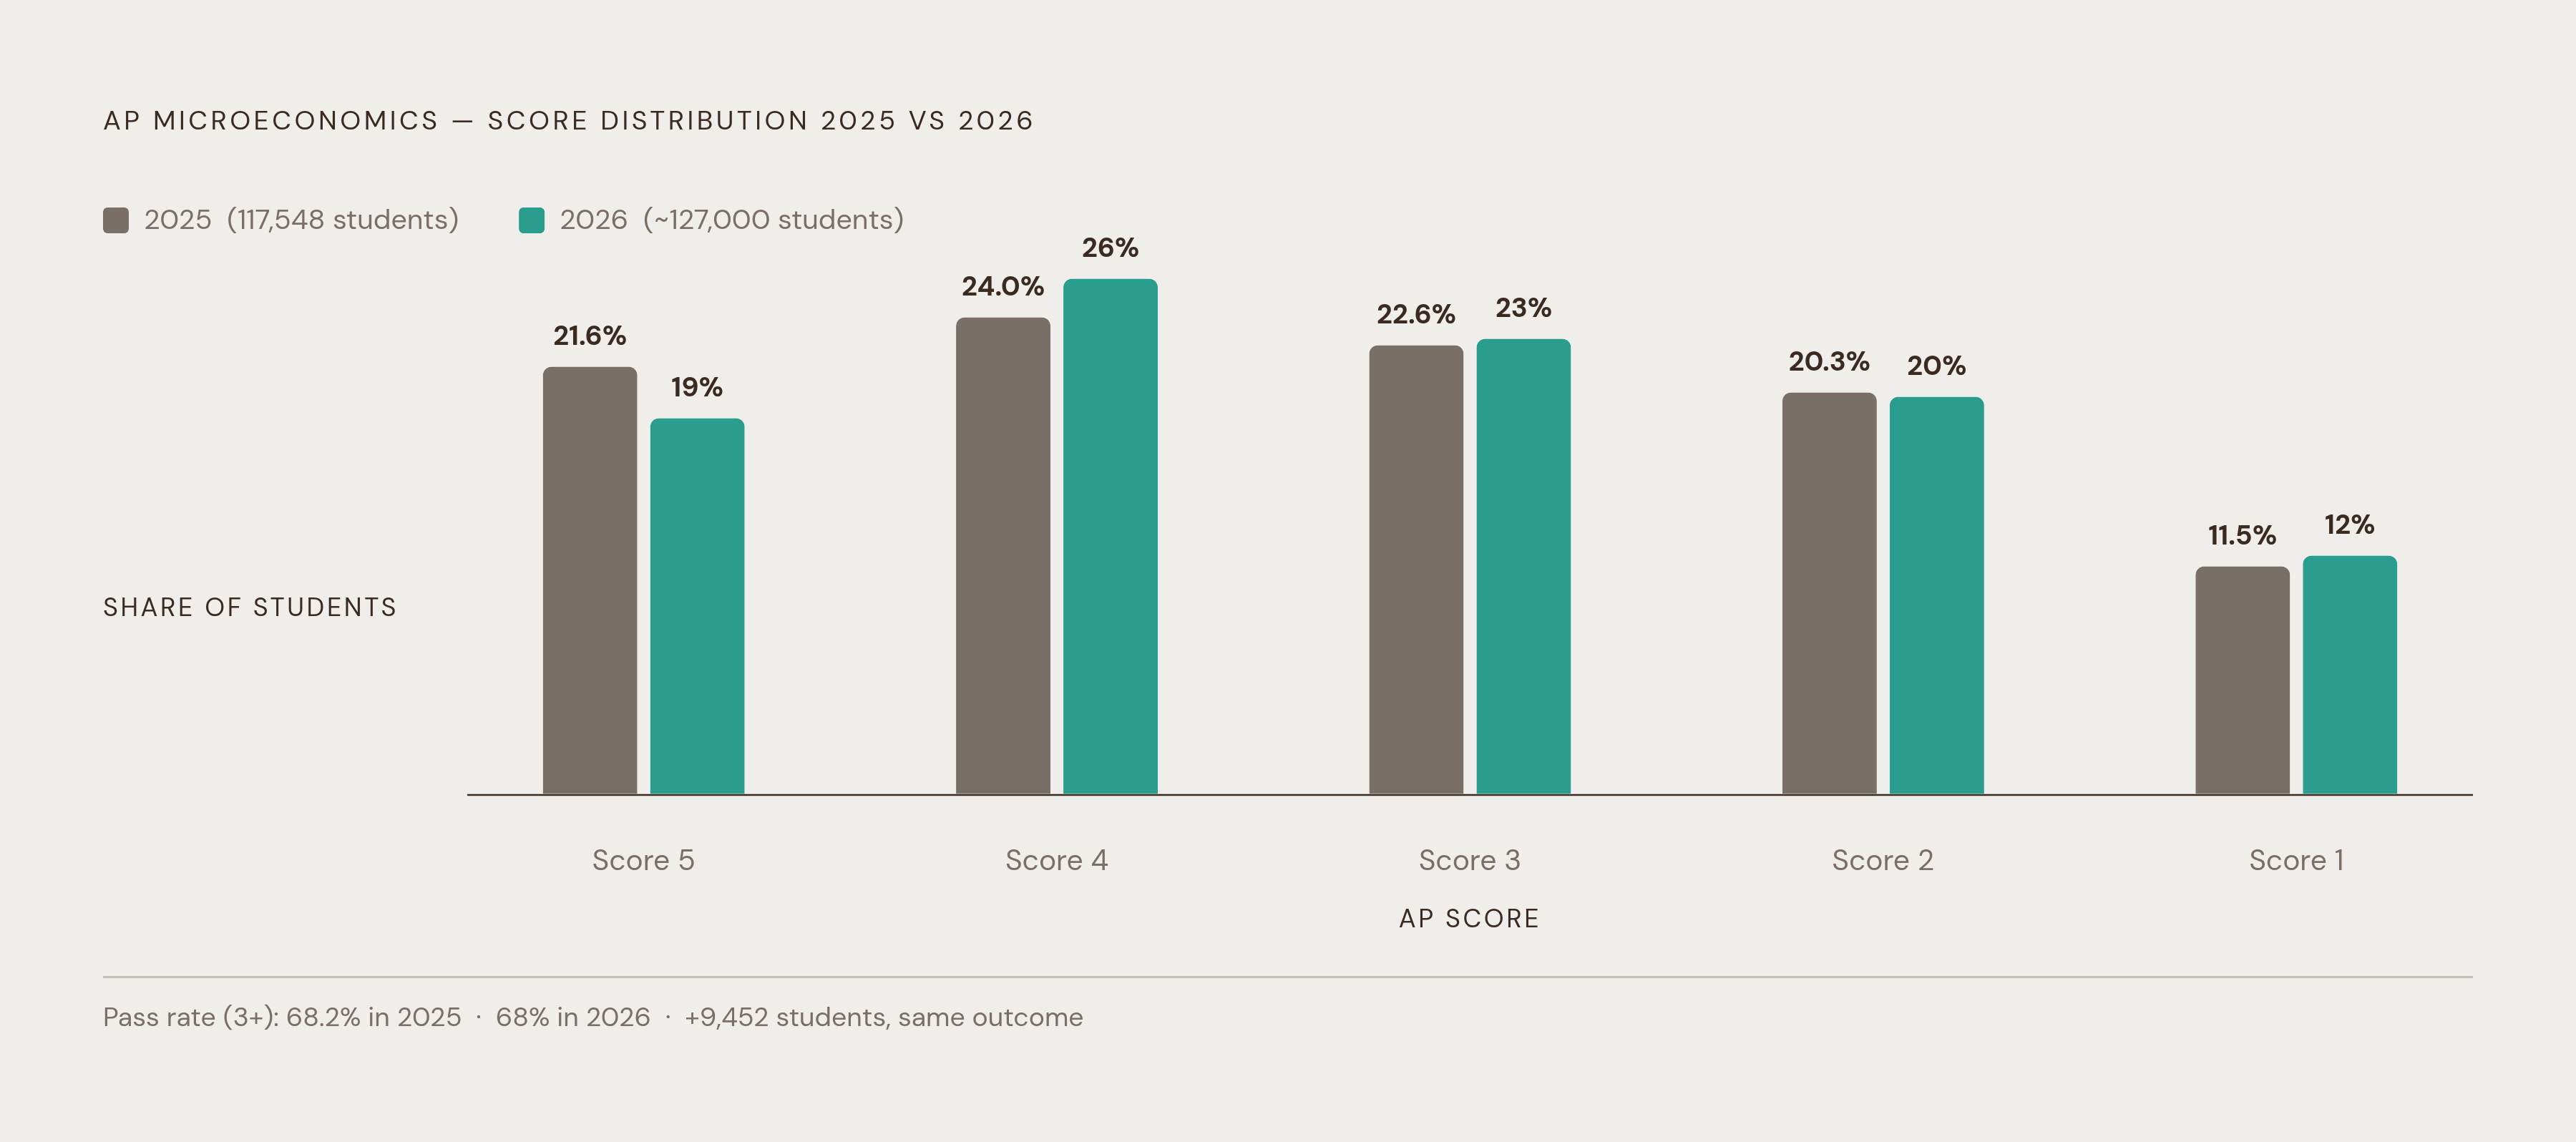
In 2026, 19% of students scored a 5, 26% scored a 4, 23% scored a 3, 20% scored a 2, and 12% scored a 1. That puts 68% of test-takers at a 3 or higher.
In 2025, the numbers were nearly identical: 21.6% scored a 5, 24.0% a 4, 22.6% a 3, 20.3% a 2, and 11.5% a 1, for a 68.2% pass rate.
Average scores have barely moved either. 3.24 in both 2025 and 2024, 3.25 in 2023. That's a flat line of difficulty across three straight years.
Enrollment growth is the cause behind that flat line. Enrollment jumped from 103,809 students in 2024 to 117,548 in 2025, and roughly 127,000 in 2026. That's a rapidly growing group of test-takers, and yet the score distribution barely shifted. More students, same difficulty curve. That stability, sitting on top of that growth, is a pretty strong signal that the gap between a 3 and a 5 is about who studied the structure of the test, not just its content. It's about who studied the structure of the test, not just its content.
How to convert the exam's structure into a concrete study plan
All of this data is only useful if it changes what you actually do with your study hours. Here's how it translates.
Match your time to the weightings. Units 2, 3, and 4 make up the majority of the exam, so they should make up the majority of your review time. Spending equal hours across all six units treats a 10% unit the same as a 25% unit, which doesn't make sense once you've seen the numbers.
Study the high-yield graphs and formulas actively, not passively. Rereading notes on MR = MC isn't the same as drawing the graph fifteen times until your hand does it without hesitation. Passive review feels productive. It isn't the same skill the exam is testing.
Practice MCQ and FRQ as two separate skills. The 66/33 split means multiple choice volume matters for your overall score, but free response demands graph accuracy and written justification rather than pattern recognition among five answer choices, making it a fundamentally different skill to develop. Drilling one doesn't automatically improve the other.
Practice handwriting graphs even while studying digitally. The hybrid format still requires a handwritten answer booklet, so drawing on a tablet or reading graphs on a screen doesn't fully prepare you for the version of the test you'll actually take.
More practice problems alone won't close the gap. What actually matters is knowing exactly where your reasoning breaks down: whether you misapplied MR = MC, mislabeled a curve, or wrote a justification that used the wrong term. A wrong answer marked simply "incorrect" doesn't tell you which of those three things happened. Feedback that explains the specific failure, not just the final score, is what turns practice into real improvement.
That's the gap Passionfruit is built to close. It offers unlimited AP Microeconomics practice problems with AI-powered grading that points to exactly where a student's economic reasoning broke down, rather than just marking the final answer right or wrong. Given how flat the national score distribution has stayed even as enrollment climbs, knowing precisely where your own reasoning falls apart may be the single highest-leverage thing a student can do before exam day.